Denbun POP Version Benchmarking - Test Results (Response Time)
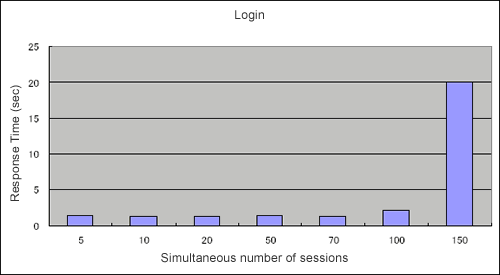
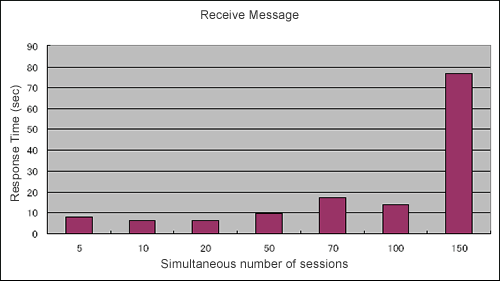
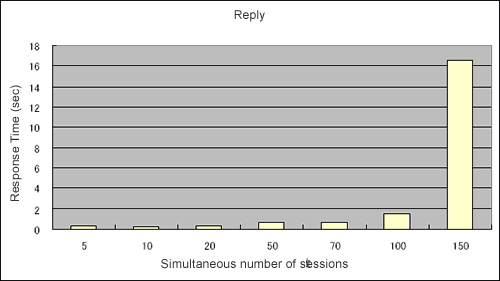
We tested according to the test method. The following tables show you average response time and throughput as the test results for scenario 1, 2, and 3.You can see the charts too.
Average Response Time (in second)
| Simultaneous number of sessions | |||||||
|---|---|---|---|---|---|---|---|
| 5 | 10 | 30 | 50 | 70 | 100 | 150 | |
| Login | 1.479 | 1.271 | 1.321 | 1.438 | 1.346 | 2.162 | 20.036 |
| Receive Message | 7.839 | 6.057 | 6.005 | 9.653 | 17.104 | 13.599 | 76.525 |
| Reply | 0.256 | 0.205 | 0.267 | 0.662 | 0.662 | 1.506 | 16.601 |
| Total of Average | 9.574 | 7.533 | 7.593 | 11.753 | 19.112 | 17.267 | 113.162 |
* The time for "Reply" does not include the time for editing message.
Throughput
| Simultaneous number of sessions | |||||||
|---|---|---|---|---|---|---|---|
| 5 | 10 | 30 | 50 | 70 | 100 | 150 | |
| Throughput (*1) | 10.851 | 25.999 | 39.949 | 37.750 | 36.963 | 36.577 | 14.564 |
| Scenario (*2) run times | 189 | 483 | 758 | 639 | 535 | 622 | 145 |
*1 Number of CGI requests/Second
*2 Number of run times of one scenario (Login -> Receive -> Reply)/5 minutes
In the Average Response Time, we can find that the fast response time with 5, 10 and 20 sessions.With 50 sessions, it took more than 10 seconds, but still 11.753 seconds.
With more than 70 sessions, it took approx. 20 seconds and getting slow.It is important to note that with 150 sessions, it makes a large impact (113.162 seconds) on the response time.
In the Throughput, we can find that the high throughputs with 10, 20, 50, 70 and 100 sessions, and the low throughputs with 5 and 150 sessions.
In the test environment, we can find that the best performance for both Response Time and Throughput with 20 simultaneous number of sessions. If we accept approx. 20 seconds for the response time at the peak time, it keeps reasonable performance with 100 simultaneous number of sessions.
Scenario run times is also maximized (758/5 minutes) with 20 sessions.
All the figures in this document are just index data and your operating environment is not assumed.Please note that this is not an actual environment.


